
The Most Stolen Cars in the UK [2026 Update]
The Nissan Juke Tekna CVT is currently Britain’s most stolen car. DVLA records from 1 January to 30 June 2026 show 197 units were taken, moving the small SUV from fifth place in last year’s rankings to the top spot.
Ford’s Fiesta still leads when considering a full twelve months. A total of 3,511 models disappeared in 2025, more than any other, although every Fiesta trim experienced a year-on-year decline.
The bigger story lies further down the list. Four pure electric cars have entered the top 20 for the first time, and hybrids now account for roughly half of the rankings.
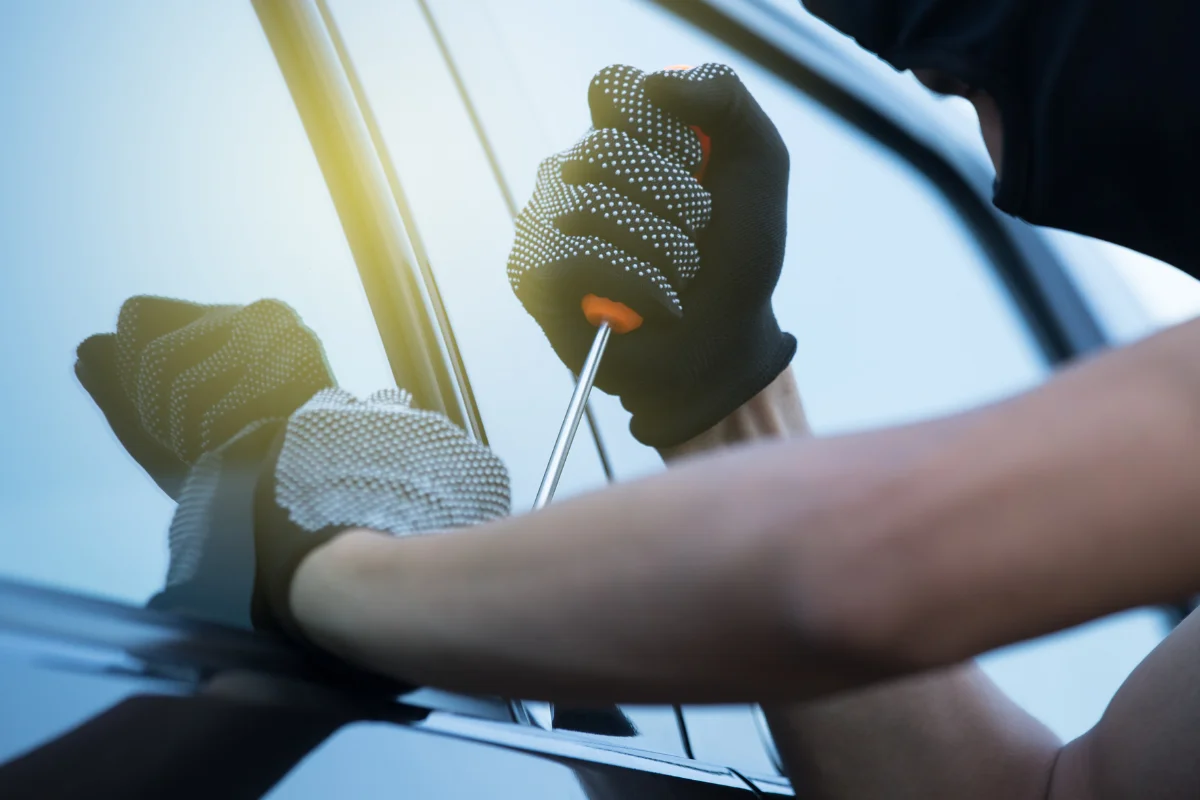
How many cars have been stolen in 2026 so far?
A total of 25,050 vehicles were recorded as stolen by the DVLA in the first six months of the year. That equates to 138 per day, or one every 10.4 minutes. This figure marks a 10% improvement from the 27,831 recorded during the same period in 2025.
Longer-term data shows the same trend. Police recorded 312,250 vehicle offences in England and Wales for the year ending March 2026, a 11% decrease from the previous period.
For a more comprehensive look, please check out our dedicated guide on Vehicle Theft Statistics 2026.
The 20 most stolen cars of 2026 so far
Tempcover analysed DVLA records at trim level rather than by model name, which is why specific variants appear below.
| Rank | Make, model, and trim | Stolen Jan–Jun 2026 |
|---|---|---|
| 1 | Nissan Juke Tekna CVT | 197 |
| 2 | Toyota C-HR Dynamic HEV CVT | 160 |
| 3 | Ford Fiesta Titanium Turbo | 140 |
| 4 | Toyota C-HR Excel HEV CVT | 125 |
| 5 | Ford Fiesta Zetec | 121 |
| 6 | Toyota Prius Hybrid | 115 |
| 7 | Hyundai Ioniq 5 Ultimate EV | 115 |
| 8 | Ford Fiesta ST-2 Turbo | 114 |
| 9 | Ford Fiesta Titanium X | 112 |
| 10 | Hyundai Ioniq Premium HEV S-A | 110 |
| 11 | Toyota (model unspecified) | 101 |
| 12 | Ford Fiesta Titanium | 100 |
| 13 | Toyota RAV4 GR Sport PHEV Auto | 92 |
| 14 | Ford Fiesta ST-3 Turbo | 90 |
| 15 | BMW 330e M Sport Auto | 89 |
| 16 | Hyundai Ioniq 5 Premium EV | 89 |
| 17 | Kia Niro 2 EV | 88 |
| 18 | Hyundai Ioniq Premium SE HEV S-A | 84 |
| 19 | Ford Fiesta Zetec Turbo | 82 |
| 20 | Kia Niro 4 EV | 76 |
Seven Fiesta derivatives appear on the list, reflecting their prevalence on British roads rather than any specific vulnerability. Toyota contributes five entries, Hyundai four, and Kia two.
Compare that to the same period a year earlier, when Ford occupied seven of the top ten spots and no battery-powered car appeared in the top 20.
Why have electric cars entered the rankings?
Growing numbers and value have brought them into focus. Registrations surged in 2024 and 2025, expanding the number of potential targets.
Components also play a role. Traction batteries, inverters, charge ports, and infotainment units all fetch high prices in the grey market, and genuine replacements are in short supply for specialist repairers.
Tempcover’s Jake Lambert warned that security must match the technology. His advice to owners includes:
- Set a PIN or biometric lock on the manufacturer’s companion app, since a password alone offers weak protection if the app stores a digital key.
- Lock charging cables so they cannot be stolen for their copper and connectors.
- Keep vehicle software up to date, as updates often close known bypass vulnerabilities.
- Store the fob in a Faraday pouch and park nose-in to limit access to front wiring.
Shop EV Charging Point protection.
The most stolen cars of 2025
Grouping by model rather than trim provides a clearer picture of annual exposure.
| Rank | Make and model | Cars stolen |
|---|---|---|
| 1 | Ford Fiesta | 3,511 |
| 2 | Volkswagen Golf | 1,625 |
| 3 | Ford Focus | 1,474 |
| 4 | Toyota RAV4 | 1,319 |
| 5 | BMW 3 Series | 1,249 |
| 6 | Nissan Juke | 1,200 |
| 7 | Toyota C-HR | 967 |
| 8 | Lexus NX | 951 |
| 9 | Range Rover Evoque | 895 |
| 10 | Vauxhall Corsa | 874 |
In 2025, 54,830 vehicles were reported stolen, an 11% drop from 61,343 the previous year. Losses remain more than double the total from 2015.
Several premium models saw improvements. Mercedes C-Class thefts fell 26% to 826, Range Rover Sport dropped 20% to 700, and Fiesta thefts declined 21% despite holding first place.
Supercars remain largely untouched. Criminals took six McLarens, seven Aston Martins, 17 Ferraris, 18 Lamborghinis, 22 Rolls-Royces, and 80 Bentleys over the same twelve months.
Why are these particular models targeted?
- Parts value: Hybrids carry platinum, palladium, and rhodium in greater quantities than petrol equivalents. Battery packs, control modules, and screens all sell quickly through unofficial channels.
- Export demand: Thatcham Research and the National Vehicle Crime Intelligence Service found that 52% of intercepted stolen vehicles bore premium or luxury badges, with SUVs accounting for 79% of these cases. The Democratic Republic of Congo leads the destination list at 38.5%, followed by the UAE (20.1%), Cyprus (6.7%), Jamaica (5.7%), and Georgia (5.1%).
- Electronic vulnerability: The Metropolitan Police estimates that electronic devices are involved in approximately 60% of vehicle thefts in the capital. Techniques such as relay attacks, signal jammers, CAN injection tools, and key programming via the diagnostic port can all bypass factory locks without triggering alarms.
- Vehicle age: Stolen vehicles typically average around eight years old. Thatcham reports that gangs are focusing on the five-to-nine-year-old bracket, as newer software is more difficult to compromise.
Insurers settled £640 million in related claims in 2024, highlighting the scale of money involved in this illicit trade.
Which brands lose the most vehicles?
| Rank | Brand | Cars stolen in 2025 |
|---|---|---|
| 1 | Ford | 7,677 |
| 2 | BMW | 5,489 |
| 3 | Toyota | 4,518 |
| 4 | Mercedes | 3,992 |
| 5 | Land Rover | 3,690 |
| 6 | Audi | 3,650 |
| 7 | Volkswagen | 3,426 |
| 8 | Vauxhall | 2,764 |
| 9 | Nissan | 2,611 |
| 10 | Lexus | 2,031 |
What is the most stolen van in the UK?
Ford Transit derivatives dominate commercial vehicle crime. The Transit 350 was targeted more often than any rival across 2024 and 2025 combined, with 1,309 incidents.
Ford accounted for 53% of all van thefts over those two years, nearly four times the number attributed to Mercedes-Benz at 2,935.
Where are the UK’s car theft hotspots?
London records more incidents than anywhere else by a wide margin, with Birmingham second and several northern cities close behind.
Highest totals:
- London: 8,145
- Birmingham: 3,220
- Manchester: 912
- Leeds: 901
- Sheffield: 899
- Coventry: 862
- Wolverhampton: 616
- Leicester: 533
- Walsall: 521
- Bristol: 506
Adjusting for local vehicle registrations shifts the focus to East London:
- Barking: 648 per 100,000 registered cars
- Hayes: 569
- Birmingham: 557
- Thornton Heath: 539
- Dagenham: 538
- London: 533
- Enfield: 527
- Ilford: 526
- Smethwick: 514
- Beckenham: 505
Where do thieves take cars from?
Typically, from home. Crime Survey findings for 2024-25 place 37% of vehicle thefts on driveways or other semi-private areas near a property.
Including streets immediately outside the house, roughly three-quarters of incidents occur within sight of the front door. Public car parks account for about 6%, with workplace bays even lower.
In other words, a car left on open tarmac at the front of a house faces much greater risk than one parked in a supermarket bay, making securing the driveway itself the highest-value change most owners can make!
How many stolen cars are recovered?
Just under half. QuestGates reported a 2025 recovery rate of 44.94%, up from 42.48% previously, with the average time between theft and recovery decreasing to 25.6 days.
Investigation outcomes also remain poor. Police closed 83.2% of vehicle offences in the year to March 2026 without identifying a suspect, and charges were brought in just 2.8% of cases.
How to protect your car from theft
At home
- Install a physical barrier, such as a driveway security post, to prevent the vehicle from being driven away.
- Store key fobs in a signal-blocking pouch or metal tin, and keep them well away from the front door.
- Park nose-in against a wall or in a garage to block access to headlight wiring.
- Add motion-triggered lighting and CCTV coverage to all parking areas.
- Use a visible steering lock, pedal clamp, or wheel clamp overnight.
- Secure the manufacturer’s app with a PIN or fingerprint if it includes a digital key function.
Away from home
- Opt for staffed or well-lit parking with camera coverage wherever possible.
- Confirm that the doors are locked, rather than relying on indicator flashes, as jammers can suppress that signal.
- Remove valuables, documents, and spare key fobs from the vehicle.
- Lock charging cables when using public chargepoints.
- Ask your dealer about any outstanding security recalls or firmware updates.
Where bollards fit into vehicle security
A driveway bollard sunk into the ground completely – whether you opt for a removable, telescopic, or automatic post – removes the escape route. Most thieves working under a two-minute window won’t stay to overcome this obstacle, and many insurers now recognise the deterrent effect when calculating premiums.
Bison supplies security posts for homes, commercial premises, and car parks, with nationwide delivery and an optional installation service for those who prefer not to handle the groundwork themselves.
Browse the full bollard range or contact us for guidance on the right specification for your needs.
Figures here draw on DVLA records released under the Freedom of Information Act and analysed separately by Tempcover, What Car?, and QuestGates; ONS crime statistics for the year ending March 2026; Home Office outcome data; Thatcham Research and NaVCIS export intelligence; plus postcode-level analysis published by the RAC.